
What is the CAGR Calculator?
The CAGR Calculator works out the compound annual growth rate: the single steady yearly rate that turns a starting value into an ending value over a given time. Enter the two values and the years and months between them. It can also work backwards, projecting an end value from a rate or showing how long a goal will take.
Up 80% in 6 years is not 13.33% a year
You put 10,000 into an investment and six years later it is worth 18,000. That is an 80% gain, and 80 ÷ 6 says 13.33% a year. But growing 13.33% a year for six years would give about 21,200, not 18,000. The rate that actually connects 10,000 and 18,000 is 10.29% a year. That is the CAGR.
CAGR is the fair way to compare investments held for different lengths of time, or to check a fund’s yearly claim. It smooths out the ups and downs, so it tells you nothing about how bumpy the ride was. If you added money along the way, use the Dollar-Cost Averaging Calculator instead.
How to use the calculator
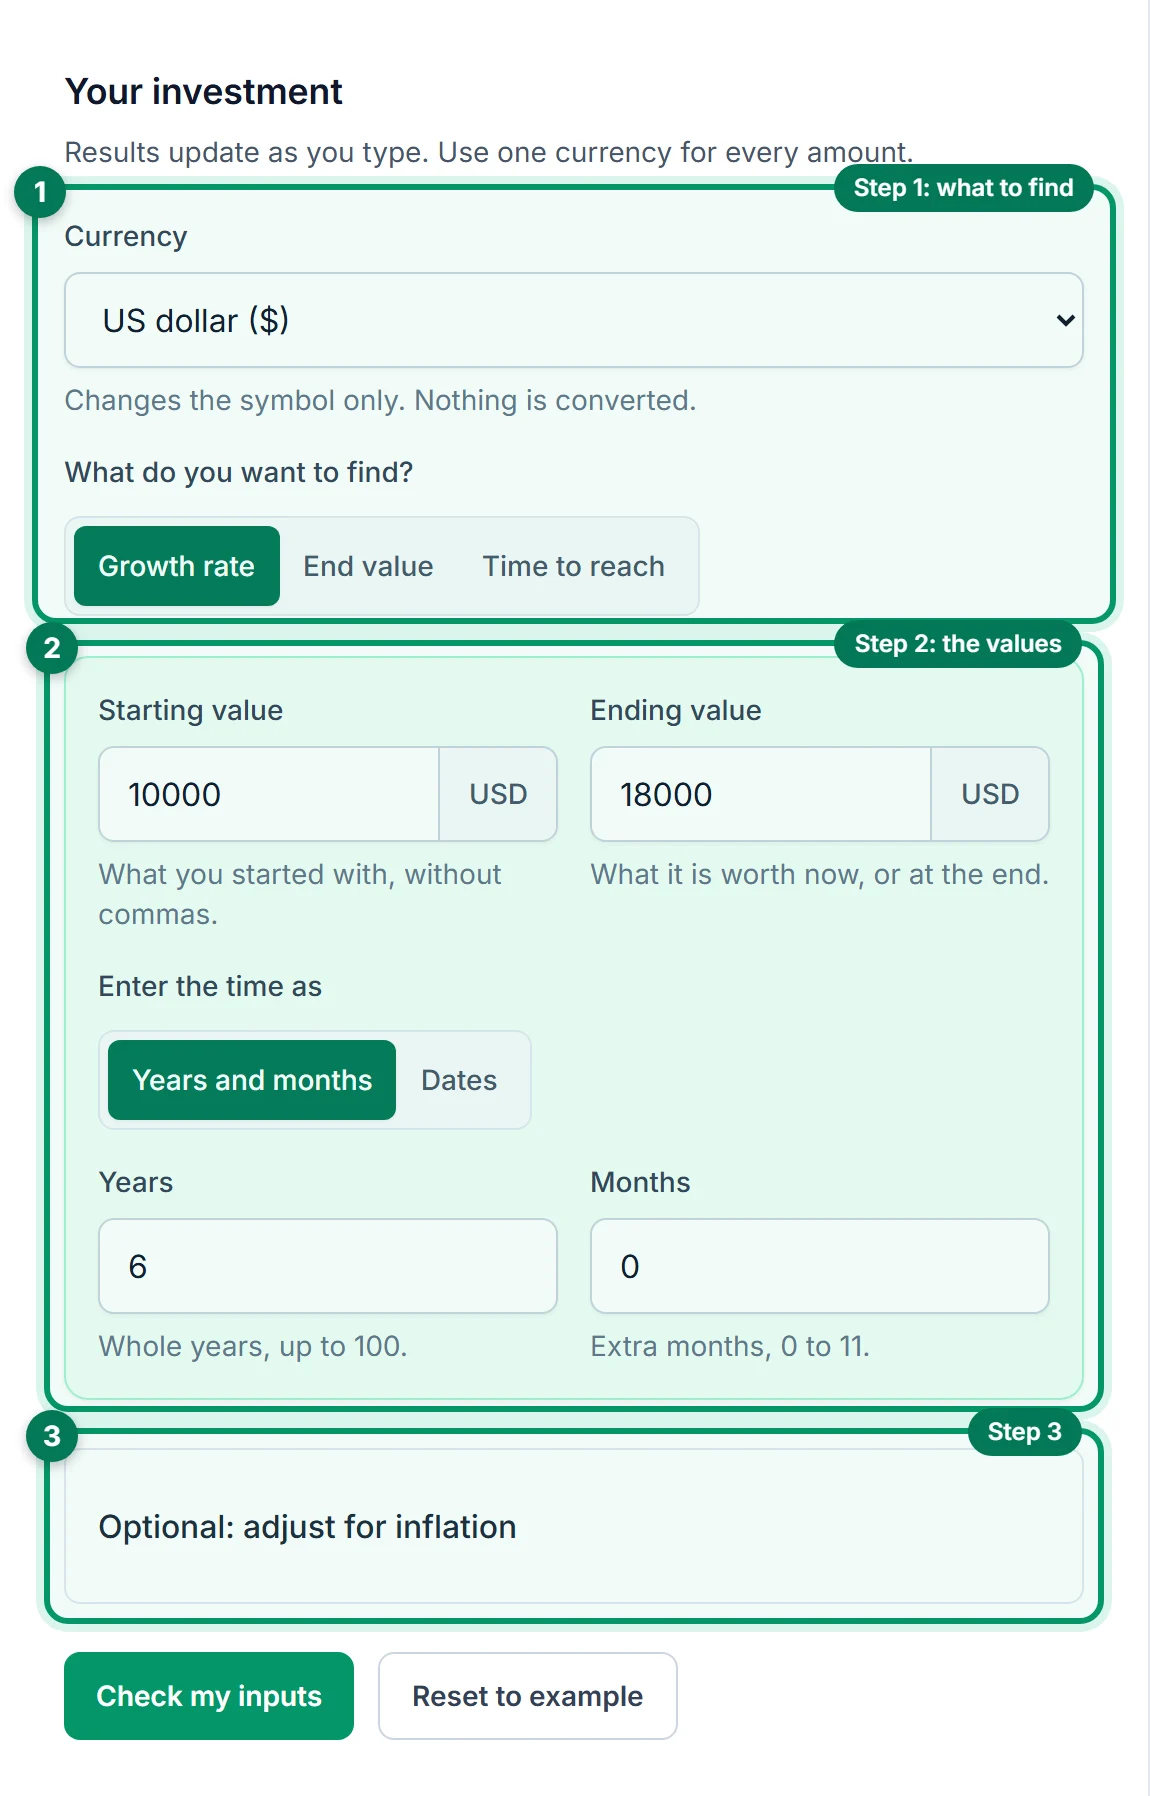
Choose what to find
Pick your Currency, then choose Growth rate to find the CAGR, End value to project forward from a rate, or Time to reach to see how long a goal takes.
Enter the values
Enter the Starting value. For a growth rate, add the Ending value and the time. Under Enter the time as, choose Years and months to type them in, or Dates to pick a Start date and End date. For the other modes, enter a Yearly growth rate, typing 8 for 8%, plus the time or the Value you want to reach.
Adjust for inflation, then read the result
To see growth in today’s money, open Optional: adjust for inflation. Results update as you type. The next section walks through every number.
Your results, explained
Here are the results for the example values: 10,000 that grew to 18,000 over 6 years, using Growth rate and no inflation. Each numbered explanation matches a highlighted area in the image.
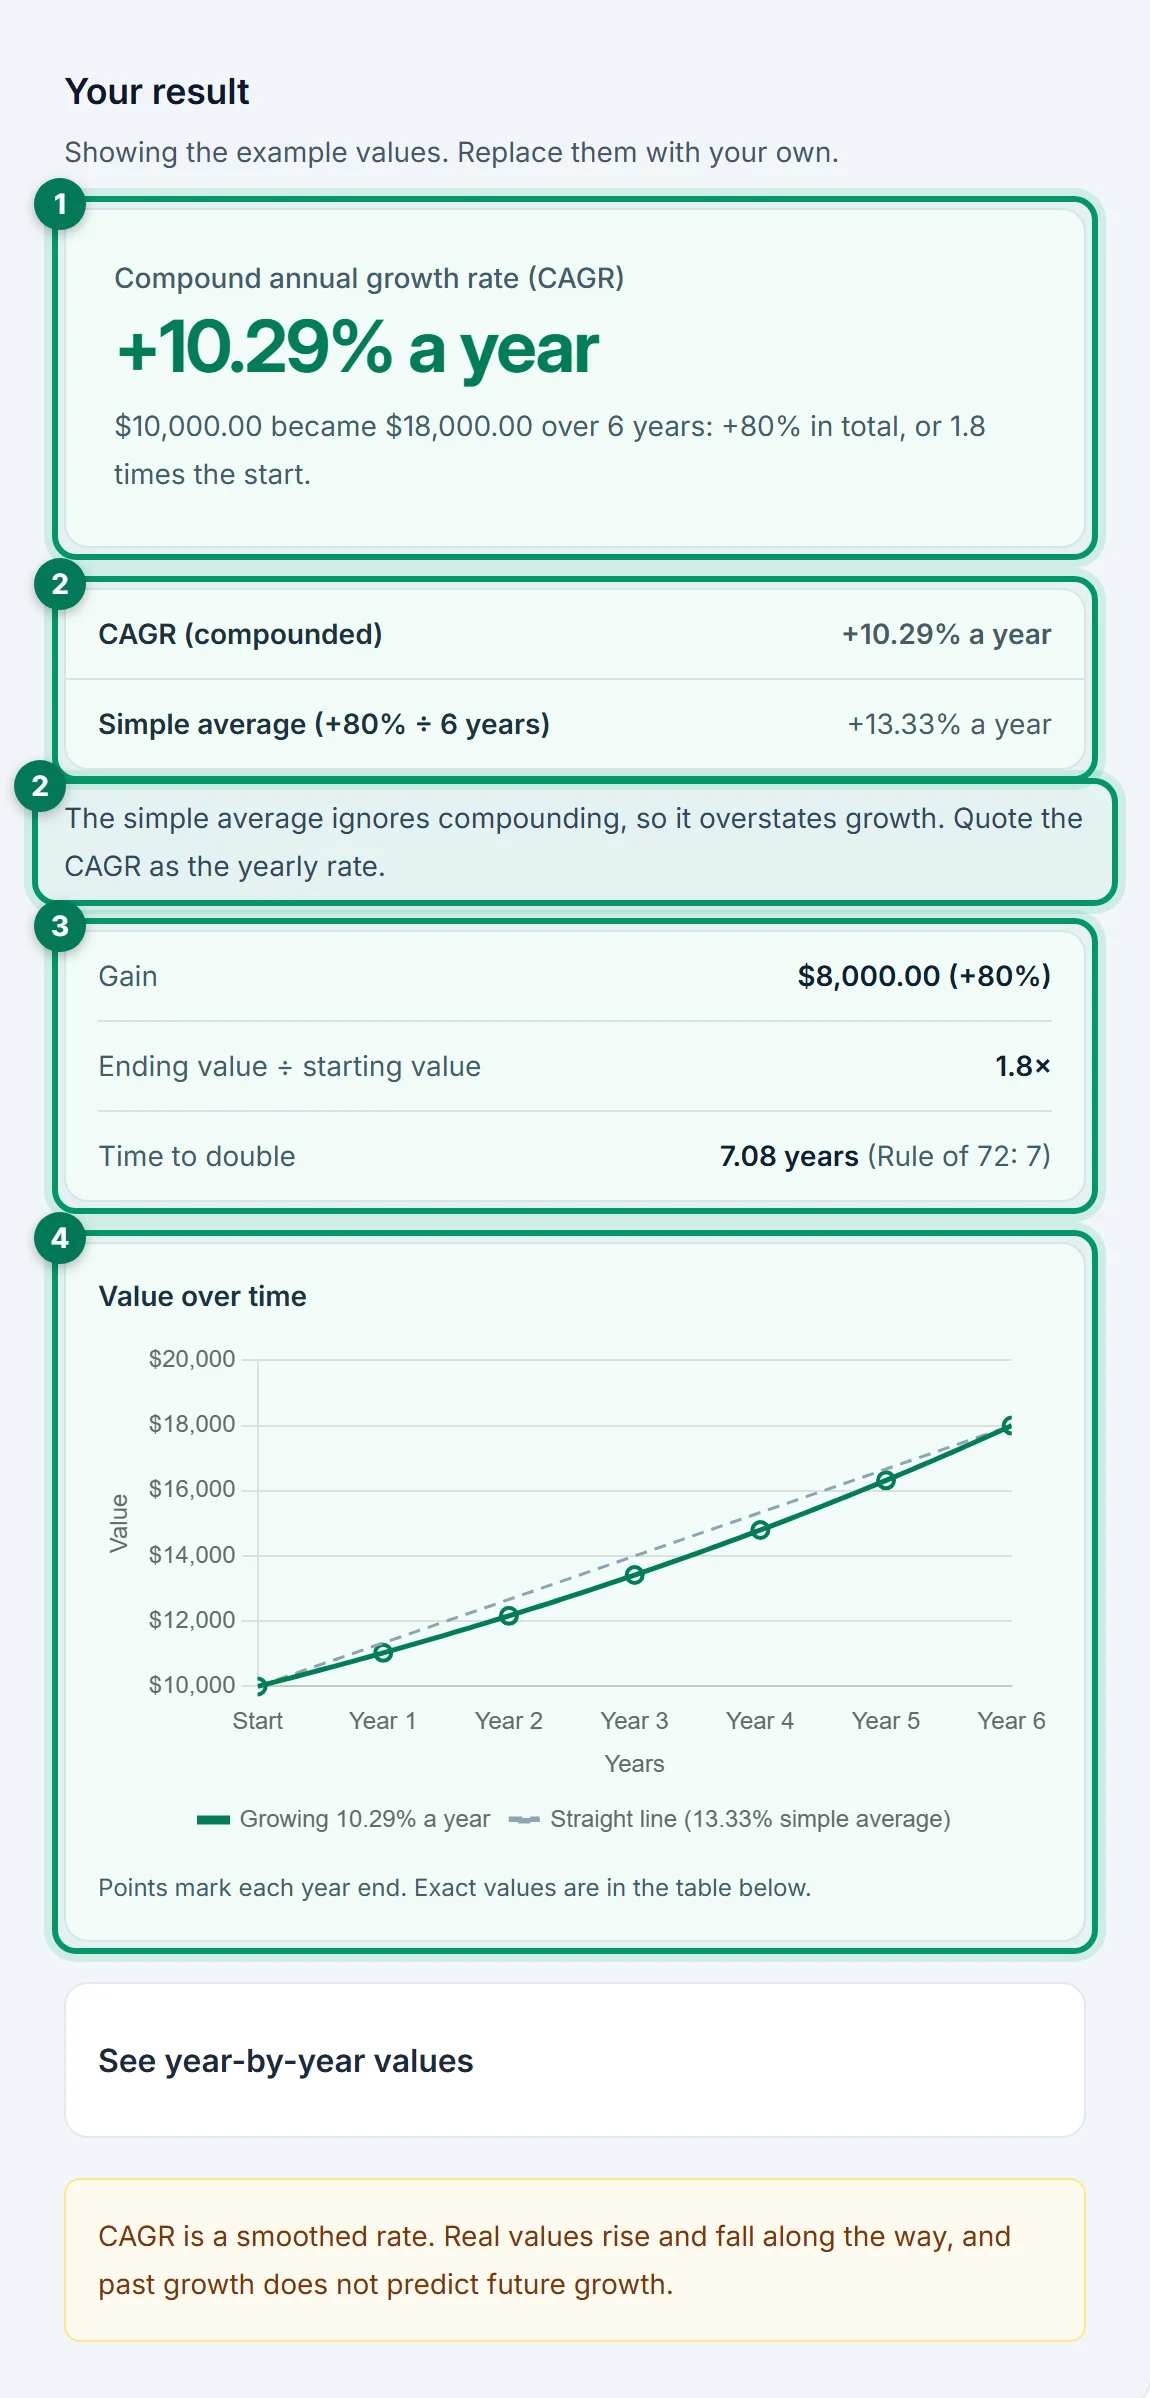
1. CAGR: +10.29% a year
The one steady yearly rate that turns 10,000 into 18,000 in 6 years: (18,000 ÷ 10,000)^(1 ÷ 6) − 1. The note underneath gives the whole-period view: +80% in total, or 1.8 times what you started with.
2. CAGR vs the simple average: 10.29% vs 13.33%
The simple average divides the 80% total gain by 6 years. It is higher because it ignores compounding: each year’s growth also grows in later years. If you quote a yearly return, quote the CAGR.
3. Gain, multiple and doubling time
The gain is 8,000 and the multiple is 1.8×. At 10.29% a year your money doubles in about 7.08 years. The Rule of 72 estimate, 72 ÷ 10.29 = 7.0, is a handy shortcut that lands close to the exact figure at rates like this.
4. The chart
The green curve is the value growing at the CAGR, with a point at each year end. The dashed grey line is a straight-line path from start to end. Both finish at 18,000, but the curve grows slower early and faster later, which is how compounding works.
Worked example: 10,000 to 18,000 in 6 years
These are the calculator’s example values, and they are illustrative only.
Growth multiple = 18,000 ÷ 10,000 = 1.8
Yearly factor = 1.81 ÷ 6 = 1.1029
CAGR = 1.1029 − 1 = 10.29% a year
Check: 10,000 × 1.10296 ≈ 18,000 (the unrounded rate gives exactly 18,000)
The path is not a straight line. At 10.29% a year, the value is about 13,416 after 3 years, not the halfway mark of 14,000, because the early years grow a smaller base. The year-by-year table shows each year end.
Why the average return misleads
Averages break down when returns swing. Suppose an investment gains 50% one year and loses 50% the next. The average of +50% and −50% is 0%, which sounds like breaking even. In fact 100 becomes 150, then 75. Enter 100, 75 and 2 years, and the calculator shows a CAGR of about −13.4% a year.
That is why fund reports and analysts quote annualised, compounded returns. When you compare two investments, compare their CAGRs over the same period, not their average yearly returns.
Projecting forward and the Rule of 72
Switch to End value to run the maths forward. 10,000 growing 8% a year for 10 years becomes 21,589.25. Switch to Time to reach to ask how long it takes to double: at 8%, 10,000 reaches 20,000 after about 9 years.
The Rule of 72 gives the same answer in your head: 72 ÷ 8 = 9 years. It is close for rates between about 6% and 10%, and drifts further from the exact figure at very low or very high rates. The calculator shows both.
Growth after inflation
A rising number is not the same as rising buying power. Open Optional: adjust for inflation and enter the average yearly inflation over the period. With 3% inflation, the example’s 10.29% becomes a real growth rate of about 7.08% a year, and the 18,000 is worth about 15,074.72 in today’s money.
The real rate uses (1 + growth) ÷ (1 + inflation) − 1, not a simple subtraction. The difference is small at low rates, but it grows when either rate is high.
Before relying on the result
- Deposits counted as growth. If you added money, the end balance includes it. Use a money-weighted return instead.
- The wrong time span. Count from the date of the starting value to the date of the ending value, including the months.
- A short period annualised. A few good months can produce an unrealistic yearly rate.
- Projecting the past forward. A past CAGR is not a promise of future growth.
Before you compare or quote a CAGR:
- Use values from the same point in each period, such as year-end prices.
- Include dividends or interest in the ending value if you reinvested them.
- Compare investments over the same dates.
- Check the real rate after inflation.
Frequently asked questions
What is a good CAGR?
Why is CAGR lower than my average yearly return?
Can CAGR be negative?
Does CAGR work for periods under a year?
What if I added or withdrew money along the way?
Should I enter years and months or dates?
What is the Rule of 72?
What does the real rate after inflation mean?
Does changing the currency convert my amounts?
Related stock calculators
Keep planning with the tools that answer the next question.
- Stock Average Down CalculatorFind your new average cost, or how many shares it takes to reach a target average. Open calculator
- Dollar-Cost Averaging CalculatorProject buying a fixed amount on a schedule and compare it with a lump sum. Open calculator
- Dividend Reinvestment CalculatorProject shares, value and income when every dividend buys more shares. Open calculator
- Stock Dividend CalculatorFind one year’s dividend income and yield from your shares. Open calculator
- Stock Profit CalculatorSee your gain or loss at today’s price. Open calculator